@petergruenbeck we were able to duplicate and fix as part of the just released 0.6.1 broker update. Please try it out and let us know if it’s resolved for you as well.
I’ve upgraded but am still seeing 100% of 1 CPU being used. I loaded up 22 simple reports and used ODBC to map them. Then without exiting ODBC, selected the same set and mapped them again. Unloaded and exited the web portal. Broker is still running flat out.
Per your original comments, we focused on the issue when you logged out of the broker. We’ll try to duplicate what you’ve described now. Please let us know if logging out does however drop the usage in the 0.6.1 broker.
Today I started from a clean main portal page and a fresh reboot of my machine.Upon starting the broker the CPU was 0 or 1%. Once logging in it hit 25% (100% of 1 of 4 CPUs) immediately. During active processing, the CPU jumps to 37% indicating a second thread is doing the actual work.
If this does not occur for your tests, one possibility is there something about the state of my server side account or folder left over from previous problems that could be causing issues for the background thread that communicates with the server. You can clean/reset my server side folders anytime. I’ll try to leave them empty most of the time.
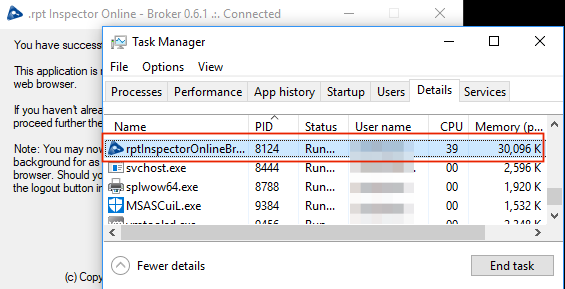
Yes. Its 0% on initial start, but jump to 100% on logon, and back to 0% at logout. This is an improvement on the previous version which used to continue at 100% on logout.
We’ve not been able to duplicate the 100% utilization on login. We continuously see 0% CPU utilization before logging in, and between 32% and 50% when logged in and then back to 0% when logged out.
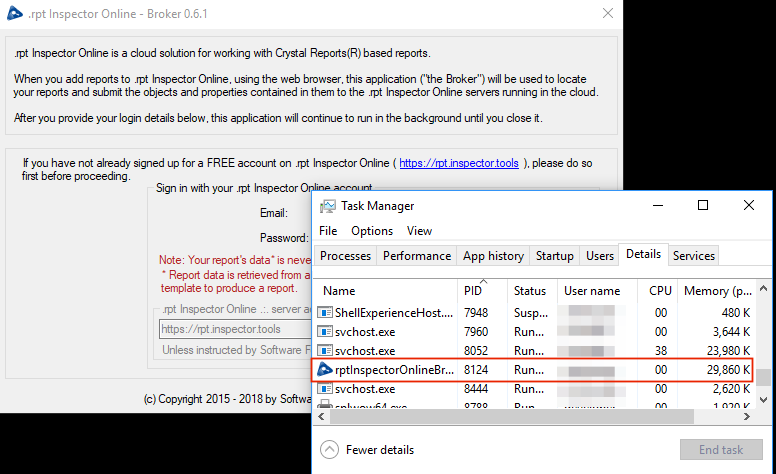
Running on Windows 10 (1709), Fall Creators Edition not logged in:
Ahh, but how many cores on your machine. Mine shows 25% but I have 4 cores so that tells me 1 task/thread is running flat out using 100% of 1 CPU, but getting moved around. I can also tell because the fans kick on after a minute or so.
Maybe try it on a VM with more than 1 CPU/core. Does the multi-threading code detect CPUs/core counts before spawning threads? If I had to guess, I’d look at the thread pool idle loop.
Just tried the released 0.6.2 in a VM with 1 CPU and 2 cores – still behaving well, with similar results as I had before when logged in. I made a bunch of actions, changing ODBC, changing formulas, saving without data. After each was completed, it did hover a little higher in the CPU utilization but then after about a minute of idle did drop back down. Can’t seem to reproduce.
 :
: